Breaking down the 20 sectors that made outsized moves during the recent rally
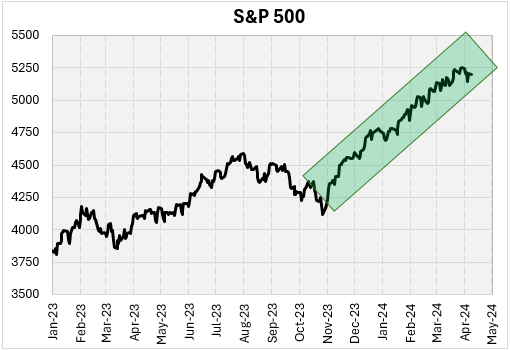
Over the last five months, stocks have been remarkably strong. Since the S&P 500 Index (SPX) bottomed in late October of last year, the broader-market index has gained over 25%. I’ve written a few articles over the past several weeks about strength in stocks. This week, I’m going to focus on sector performance during this rally. I’ll also see what option buyers have been doing during this rally compared to the timeframe just before the rally.

Best & Worst Sectors During the Rally
Using a list of stocks that have decent option liquidity, I separated the them into 27 sectors and summarized the returns since the start of the current rally. The table below lists the 10 sectors with the highest average stock return.
Biotech stocks lead the way, but the average is skewed by some huge individual stock returns. Note that the median return for that sector is the lowest in the table. Also, in the table, I summarized the returns for the five months before the rally. Specifically, it looks at the return from the beginning of June until Oct. 27, the low point on the SPX in October. The biotech names struggled in the period leading up to the rally.
Banks and brokerages listed in the table have also performed well. Those two sectors consist of 39 stocks combined. All 39 stocks have been positive during the rally. Real estate investment trusts (REIT) is a sector that did not crack the top 10 in average return, but does consist of 12 stocks that were all positive (they ranked 11th with an average return of 34%). It seems you could not have gone wrong with anything in the financial realm over the past five months.

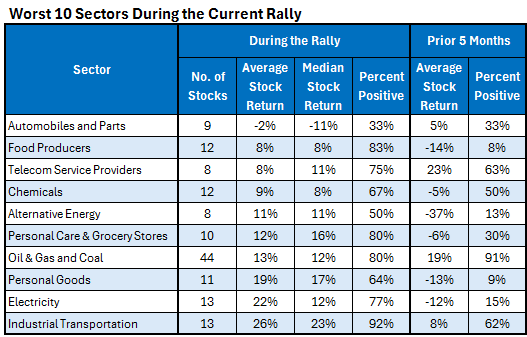
This next table shows the 10 worst sectors during the current rally. The automobiles and parts sectors is the only sector in which the stocks averaged a negative return. They averaged a 2% loss, with just three of nine stocks in that sector positive. The worst sector during the five months preceding the rally was the alternative energy sector, which averaged a 37% loss during those prior five months. It’s also been one of the worst sectors during the current rally. The eight stocks in that sector meeting the option liquidity criteria averaged an 11% return, with half of the stocks positive.

How Have Options Traders Reacted?
The table below shows the 10 best sectors by average stock return. So, it’s the same sectors as the first table above. The data gives a good idea about how option buyers have behaved recently during the rally compared to before the rally. I used buy-to-open (BTO) option volume which only considers option volume initiated by buyers. Looking at the pharma and biotech sector (the first row), calls were bought heavily compared to puts during rally. The BTO call/put ratio during the rally was 2.74. In the five months before the rally, calls and puts were bought almost evenly. The last column shows the volume during the rally was 12% higher than the five months before the rally (the ratio is 1.12).
Two of the sectors, despite these being the best sectors during the rally, showed fewer calls relative to puts during the rally. Those are the industrial metals and mining sector and consumer services.

Finally, this last table shows the 10 worst performing sectors during the rally. The worst performing sector has been the automobiles and parts sector. Option buyers haven’t changed their behavior much for these stocks. There has been about 10% less volume with the BTO call/put ratio being almost identical during the rally to the five months preceding the rally.
There was a huge increase in BTO option volume for the chemicals sector. Volume increased about 50% and calls have gotten popular compared to puts. The BTO call/put ratio was 1.05 in the five months before the rally but during this rally the ratio has been 2.21.


